How to do a content inventory or audit
Ninety-nine percent of the articles on content inventories or audits suggest a spreadsheet, and often immediately jumping to suggest specific fields. Most articles get content analysis wrong, since they neither step back to goals (step one below) nor question the approach to be anything other than brute force (step two below).
Do not automatically rush to a spreadsheet or standard template! Yes, it will work 80% of the time, but be intentional about it (read on) and avoid the brute force approach for that 20% where it doesn't work well.
Steps for a high impact content analysis
The only reason for content analysis is to make (or prepare for) high impact changes. We suggest the following steps for a content inventory or audit:
Define what you are trying to accomplish.
Decide on overarching approach. ← Most articles leap straight to assuming a brute force spreadsheet approach.
Prioritize the question(s) you want answered. ← A key element rarely discussed
Collect the basics.
Refine the data.
Present. ← Not discussed in most articles.
Take action.
Repeat/Update. ← Iteration directly impacts analysis approach
Step One: Define what you are trying to accomplish
Your goals should be specific to the digital presence and owner(s). Here are some typical goals:
Goal |
When |
Fields typically helpful toward getting the most useful fields |
Most useful fields |
|---|---|---|---|
Plan a content / digital transformation or migration (such as simplifying a site) |
Already committed to a transformation |
Fields toward making decisions: Content Type (or other category fields), Date Published (or other quality fields), Page Views (or other user fields) |
Fields about the actual decision: Disposition, Resourcing, Effort |
Dig into known pain point / question / hypothesis to understand current situation and explore possible solutions |
Already identified specific issue(s) that need to be understood / addressed |
Ideally, you directly discover the problems, but sometimes intermediate fields are needed (such as when the problem exhibits itself in different ways that each need to be discovered first). |
Information about the problem: Has Problem, Problem Count, Problem Example; and ways to slice where the problem occurs Content Type (or other category fields) |
Provide better and lower risk bids |
Bidding on / pricing a possible client digital project |
There are two reasons for pre-contract content analysis: provide a better bid and reduce your risk. To provide a better bid, you want to do enough analysis toward the goals stated in the RFP or other request. So the fields vary. |
To reduce risk, you want to understand how pervasive (and different) issues will be that drive up your effort (see Problem fields above as well as fields such as Source System. In addition, sometimes simple reports (e.g. a list of all domains encountered in an initial crawl) can differentiate. |
Devise a living content strategy |
When recognize a strategy needs to be developed for higher impact now and over time |
In general, we need to start with the way things are now, and in particular we wantContent Type (or other category fields like Site Type) and Quality metrics. |
In general, we need to start with the way things are now, and in particular we want Content Type (or other Category fields like Site Type) and Quality metrics. |
Ongoing maintenance and local changes |
Owner of particular site or section wants to improve their content. |
Ideally there are already values that are already tracked as part of a dashboard. |
In general we want changes that would be the highest impact prioritized and clear. |
Inform stakeholder discussions |
When approaching stakeholders about digital changes |
We want to avoid going "blind" when approaching stakeholders. The ideal pre-analysis we bring is 80% correct but needs stakeholder confirmation/tweaking. |
If we are going to stakeholders about making changes, we want decision fields (even if tentative) as well as tentative target values. |
A quick few notes about the suggested fields in the below table (a field is a piece of information you want in your analysis, typically for each "row" which represents a piece of content):
The most useful fields are those that are ultimately useful. You may not be able to directly get those fields.
The "fields typically helpful toward getting the most useful fields" are those that may be helping in getting to the fields that are ultimately useful.
Yes, every situation varies. The main point of listing these fields is to illustrate how the goal varies what kinds of pieces of information you want in your analysis.
Your goal not in the list above? No problem. Just be intentional and decide on your goal before you define your approach.
Step Two: Decide on overarching approach
Things to consider when deciding upon your approach:
How complex is your digital presence? Spoiler alert: if it's complex, do not use a spreadsheet. Not sure if you have a complex site? Use the calculator below.
Remember in an inventory or audit you can separate out deciding about content from acting on the decisions. If this seems crazy, please read Decide. Don't Inspect. and Rules for Content Migration and Large Scale Improvements: Panning for Gold.
You can sample content in order to make decisions about all content.
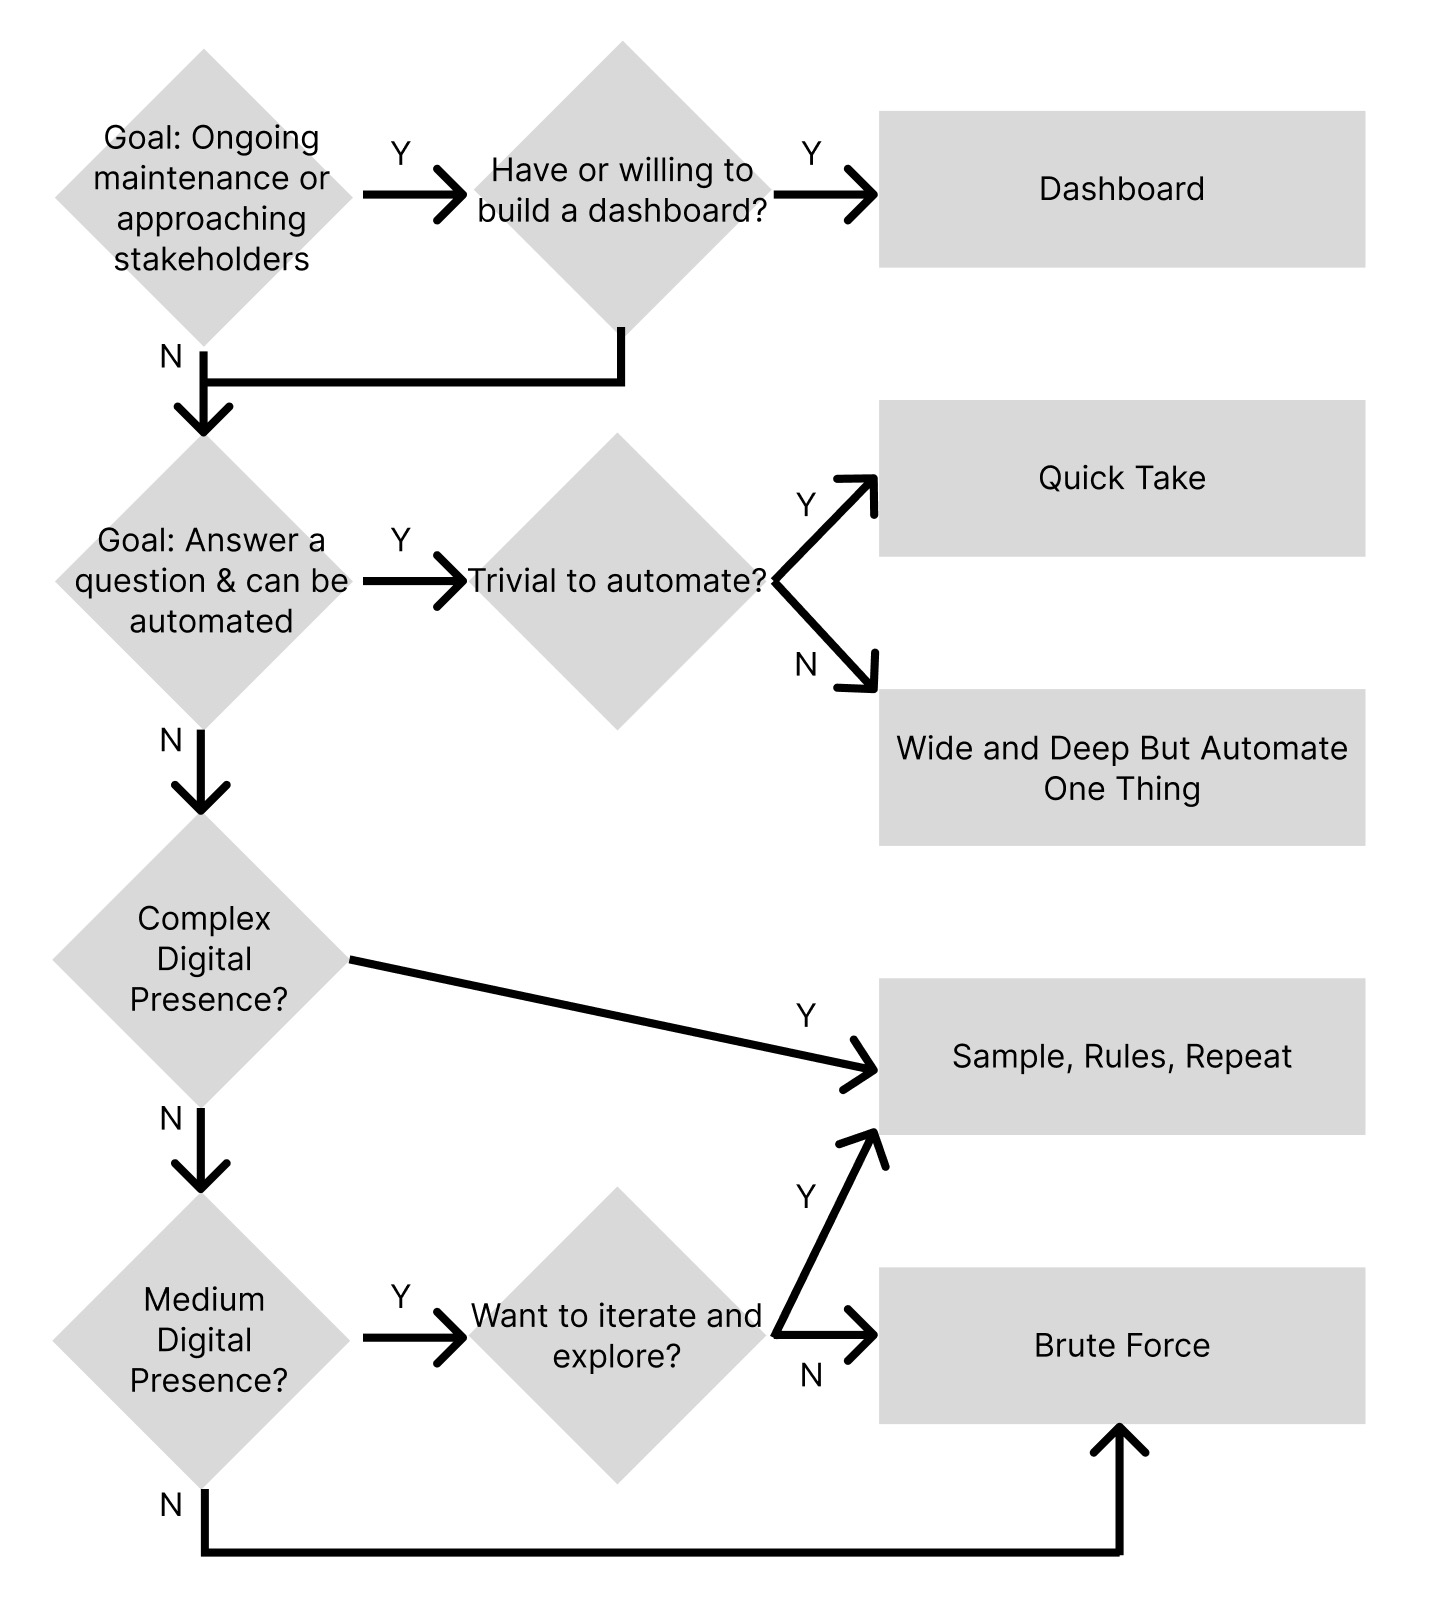
What is your goal? See the flowchart below for more on selecting an approach based on goals.
There are at least four possible approaches: brute force; sample, rules, repeat; quick take; and wide and deep but automate one thing.
Brute Force
99.9% of the articles written on content inventories, audits, and analysis leap straight into spreadsheets, assuming a line-by-line, manual analysis. This probably works for 80% of all websites and goals. But it does NOT work for complex digital presences.
Sample, Rules, Repeat
In this model, we: a) assume we will be iterating (see Rethinking the Content Inventory: Exploration) and b) we become comfortable with applying rules to keep improving our analysis. The process is that we: 1) take whatever state we currently have in order to 2) intelligently sample the content so that we can 3) define rules to apply across all content and then 4) repeat as necessary.
Quick Take
In a quick take, we just take whatever our toolset can provide quickly. For example, if you all you care about is the length of the meta description, then run Screaming Frog or another tool and quickly get that information. Warning: it's easy for tool vendors to say something is easy. You have to consider the knowledge required to pull it off. For instance, the length of the meta description is actually easy in Screaming Frog since it's a default. But any game that requires xpath or regex or something is not trivial, although tools can make the easier or harder.
Wide and Deep But Automate One Thing
Sometimes we have a specific question that isn't trivial to answer, but we can discover automatically. In that case, we can restrict our analysis to that one thing. For example, if all you care about is near-duplicate text on pages, Content Chimera can get this after some configuration.
Each of these has advantages, although few get much coverage in articles online:
Basic Approach |
Articles percentage |
Effective on sites |
Advantages |
What is this |
|---|---|---|---|---|
Brute Force |
99%+ |
80% |
Everyone knows how to do, software already on everyone's desktop, tons of resources on this approach |
Plow through spreadsheet |
Sample, Rules, Repeat |
< 1% |
20% |
Exploratory, iterative, scalable, speed to insight, decisive |
Manually sample a site and then define rules to discover patterns |
Quick Take |
< 1% (mostly tool vendors) |
20% |
Little effort, perhaps with a cost for the tool |
Click and run a canned report from a tool |
Wide and Deep But Automate One Thing |
< 1% |
20% |
By isolating one question and automating the discovery, able to quickly get an answer |
Through some means (usually configuring a tool), automate answering one content question |
Dashboard |
< 1% |
Most sites |
Ongoing reporting and improvement |
An auto-updating dashboard representing factors important to your digital presence |
Although obviously not perfect, here is a simple flowchart that illustrates when to use each approach:
Step Three: Prioritize the question(s) you want answered
There's only so much you can do in your content analysis. Some might argue for a "kitchen sink" approach, where you throw all the information you can possibly get your hands on into the inventory. In general, we at David Hobbs Consulting advise against this approach. One reason is that it may encourage a narrow analysis (just "important" content or just one site section or one site of a large digital presence), but another is that we can get lost in what you're even trying to do (losing sight of your goal). Furthermore, there is almost always a quality issue in the information you bring into the analysis, so focusing on the information that's most important allows you to ensure it is high quality. Lastly, there may be some information that would be relatively difficult to get that you should focus on rather than going for volume.
If we have defined our goal and our approach, the next step is to prioritize the content questions we have (or, if we already isolated to one question, then we can run with that in defining our approach in the previous step).
What are example content questions?
How consistently are our templates used across our digital presence?
How pervasive are different metadata facets by content types across our digital presence?
We found walls of text on some key pages. Is this a general issue on this site, or just pages that we just stumbled upon?
If we win this bid, we will be responsible for the transformation/migration of content. There are many pages that have a hard-coded width. How many pages are like that on the site?
Which content types are the ones that perform best?
What unique items per site should they concentrate on?
Note that in Chimera you can create annotations, so you find example pages and can enter a question/hypothesis when you add it.
By prioritizing your questions, you:
Are able to reprioritize questions as you continue (answering one question might uncover one you hadn't originally considered).
Get initial answer(s) first.
Are more efficient.
Step Four: Collect the basics
First we should collect whatever is easy to collect (most usually what can be easily automated). This will be the baseline that we work from, and should result in a "row" per content item (and include basic fields such as URL and title). In this step, we should try to ensure that our list is complete (we have an item in the inventory for every content item in our scope).
Step Five: Refine the data
This is where our prioritization comes into play. We have certain questions that we have that are higher priority to answer than others. Meanwhile, some questions are harder to answer than others. We balance all this to decide what additional fields to add to our analysis in order to answer the highest priority questions.
This collection could be done in a variety of ways:
Advanced Algorithms (such as graph network analysis, probabilistic algorithms to find near duplicate content, and AI algorithms)
Analytics, such as Google Analytics, Adobe Analytics, or Matomo
CMS, such as Drupal.
Content Quality Tool, such as Siteimprove.
Crawler, such as Screaming Frog.
Formulas, combining other fields
Manual Review, when someone needs to manually review
Maps & Rules, when we use rules to discover and leverage patterns
Scraper, such as OutWit Hub
Step 6: Present
Except in isolated cases (like a team deciding what to do with their local site or site section), a spreadsheet has very limited presentation advantages:
You only see the trees and not the forest in a spreadsheet.
The higher up the organization ladder (required to make higher and higher impact digital changes), the less likely they are going to be interested in a spreadsheet.
So we need to present our analysis. We may want to present analysis to:
Individual site / site section owners.
Our management.
Upper management.
External vendors.
We have to decide on the reason we are presenting (which is related to our goal):
To incite change. In these, we want to emphasize the magnitude of current problems and the vision for what's possible.
To develop a plan. In these, we need to weave in our analysis into the action plan.
To report on a single pain point / question / hypothesis. Here we may want simply the global answer ("this is a pervasive issue"), or, more likely, we want to see the distribution of the problem along some category (like what content types the problem is concentrating in).
To just get some key points. Sometimes we just want some information that we can use elsewhere, such as to provide better and lower risk bids. In these cases, we may just want some very top level information.
To create a dashboard. We may want a dashboard for ongoing content improvement.
In general we want to present a combination of:
Charts, for instance a treemap showing the relative size of sites by type of site
Screenshots, to illustrate problems concretely (usually backed up with number or charts to indicate the distribution of those problems) or to compare with competitors
Text and tables, to build the narrative about what you are trying to make happen.
Big numbers, like simple statements such as "63% of pages are over 5 years old"
Sometimes these presentations being interactive is the absolute highest impact, so that live you can drill down when people have questions about the charts.
Step 7: Take action
Really the only reason to do content analysis is toward taking some action. So take that action!
Step 8: Repeat / update
Iterating may take place at any of the above steps as well, but regardless of when we do that, in general we want to iterate and/or update our analysis. This is one big disadvantage of the brute force approach, since it greatly discourages iteration at any scale.